

Estimation of Total Nitrogen Content in Canopy Leaves of Apple Trees Based on Hyperspectral Remote Sensing
-
摘要:
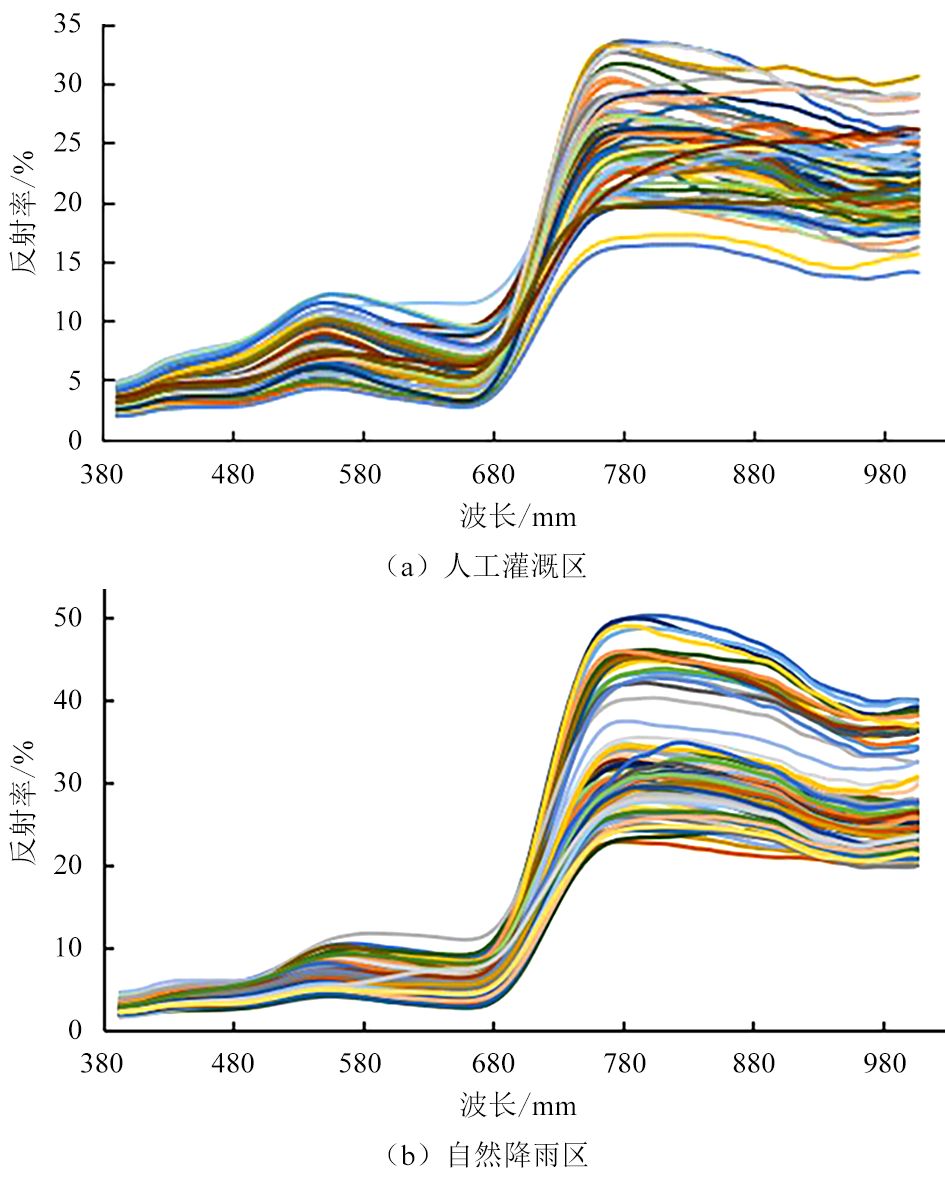
快速准确获取大面积果园冠层叶片全氮含量(leaf nitrogen content,LNC)是实现现代精准农业的基本要求。通过无人机高光谱成像仪(391.9~1006.2 nm)采集了甘肃省静宁县两个典型果园的果树冠层光谱图像,包括人工灌溉的苹果示范园与自然降雨的苹果园,综合比较两区共160份冠层叶片样本的原始光谱反射率(OD)、倒数光谱(RT)、对数光谱(LF)和一阶微分光谱(FD),构建任意两个光谱波段集组合的差值光谱指数(difference spectral index,DSI)、土壤调节植被指数(soil adjusted vegetation index,SAVI)、归一化差值光谱指数(normalized different spectral index,NDSI),分析3种光谱指数与叶片氮含量的相关性,利用一元线性回归模型与光谱指数构建两区最佳苹果冠层LNC估测模型。结果表明,人工灌溉区的FD-SAVI(825,536)、自然降雨区的LF-SAVI(854,392)与LNC的相关性最强,并基于FD-SAVI、LF-SAVI构建一元线性回归模型。人工灌溉区构建的FD-SAVI-ULRM估测模型精度最高,验证集
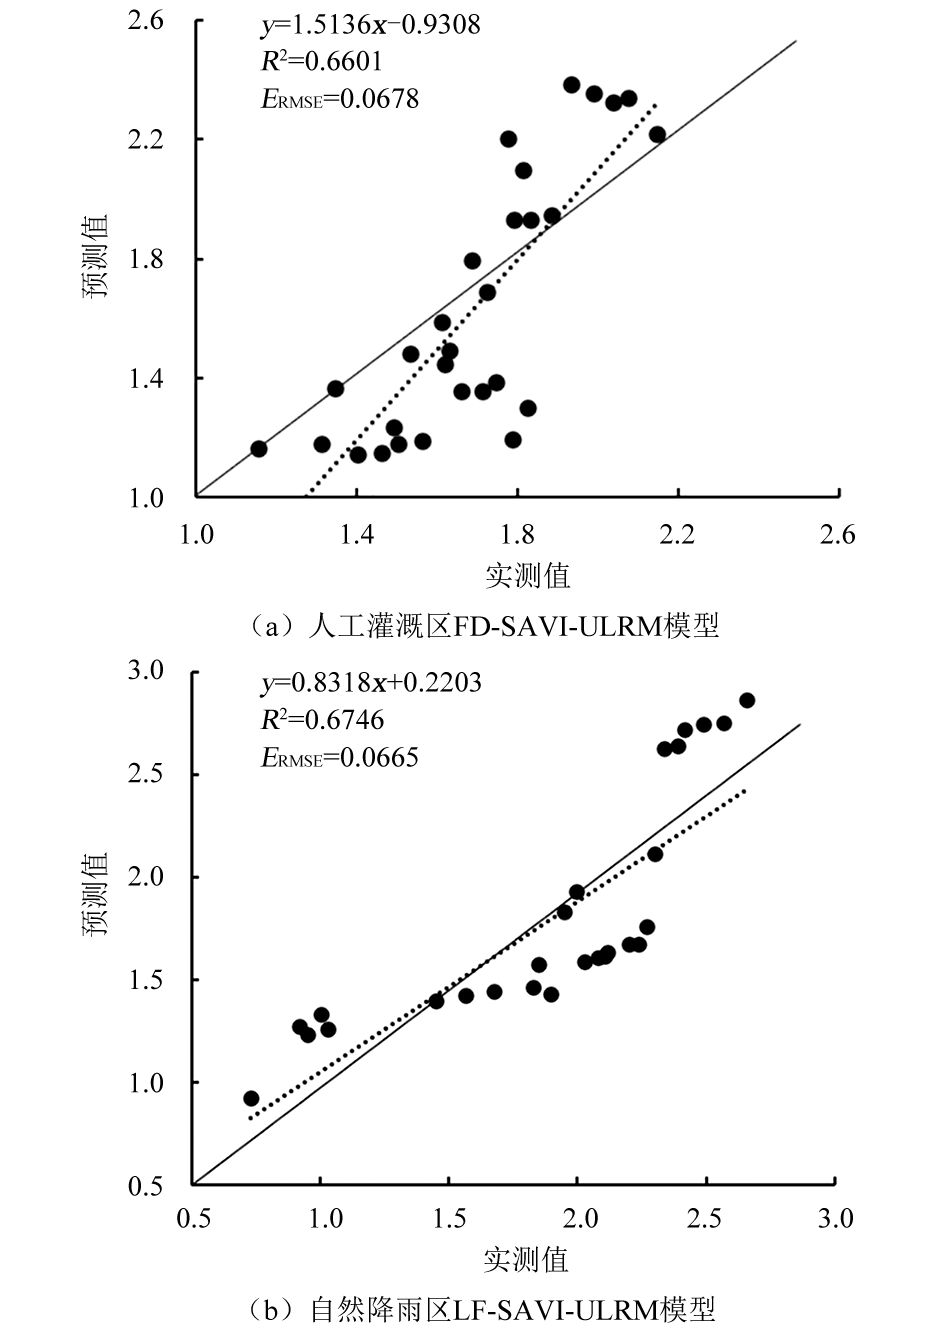
R ²和E RMSE分别为0.6601和0.0678;自然降雨区构建的LF-SAVI-ULRM估测模型精度最高,验证集R 2和E RMSE分别为0.6746和0.0665。试验采用LNC模型绘制出两个试验区的苹果树冠层叶片LNC估测图,实现对果园叶片全氮含量的精准掌握及精细化管理。Abstract:Quickly and accurately obtaining total nitrogen content(LNC)of canopy leaves in large-scale orchards is a basic requirement for achieving modern precision agriculture.Canopy spectral images of two typical orchards in Jingning County, Gansu Province were collected using a drone hyperspectral imager(391.9 to 1006.2 nm), including artificially irrigated apple demonstration orchards and naturally rained apple orchards.Original spectral reflectance(OD), reciprocal spectrum(RT), logarithmic spectrum(LF), and first-order differential spectrum(FD)of 160 canopy leaf samples from two regions were comprehensively compared.Difference spectral index(DSI), soil adjusted vegetation index(SAVI), and normalized differential spectral index(NDSI)for any combination of two spectral bands were constructed, correlation between three spectral indices and leaf nitrogen content was analyzed, and a univariate linear regression model and spectral indices were used to construct the best LNC estimation model for apple canopy in two regions.Research showed that correlation between FD-SAVI(825, 536)in artificial irrigation areas and LF-SAVI(854, 392)in natural rainfall areas was the strongest, and a univariate linear regression model was constructed based on FD-SAVI and LF-SAVI.FD-SAVI-ULRM estimation model constructed in artificial irrigation areas has the highest accuracy and validation set
R 2 andE RMSE were 0.6601 and 0.0678; LF-SAVI-ULRM estimation model constructed in natural rainfall areas has the highest accuracy, with validation setR 2 andE RMSE was 0.6746 and 0.0665.This experiment used the LNC model to draw the LNC estimation maps of apple tree canopy leaves in two experimental areas, achieving precise control and refined management of total nitrogen content of orchard leaves.-
Keywords:
- hyperspectral /
- remote sensing /
- total nitrogen content /
- vegetation index /
- inversion /
- apple tree
-
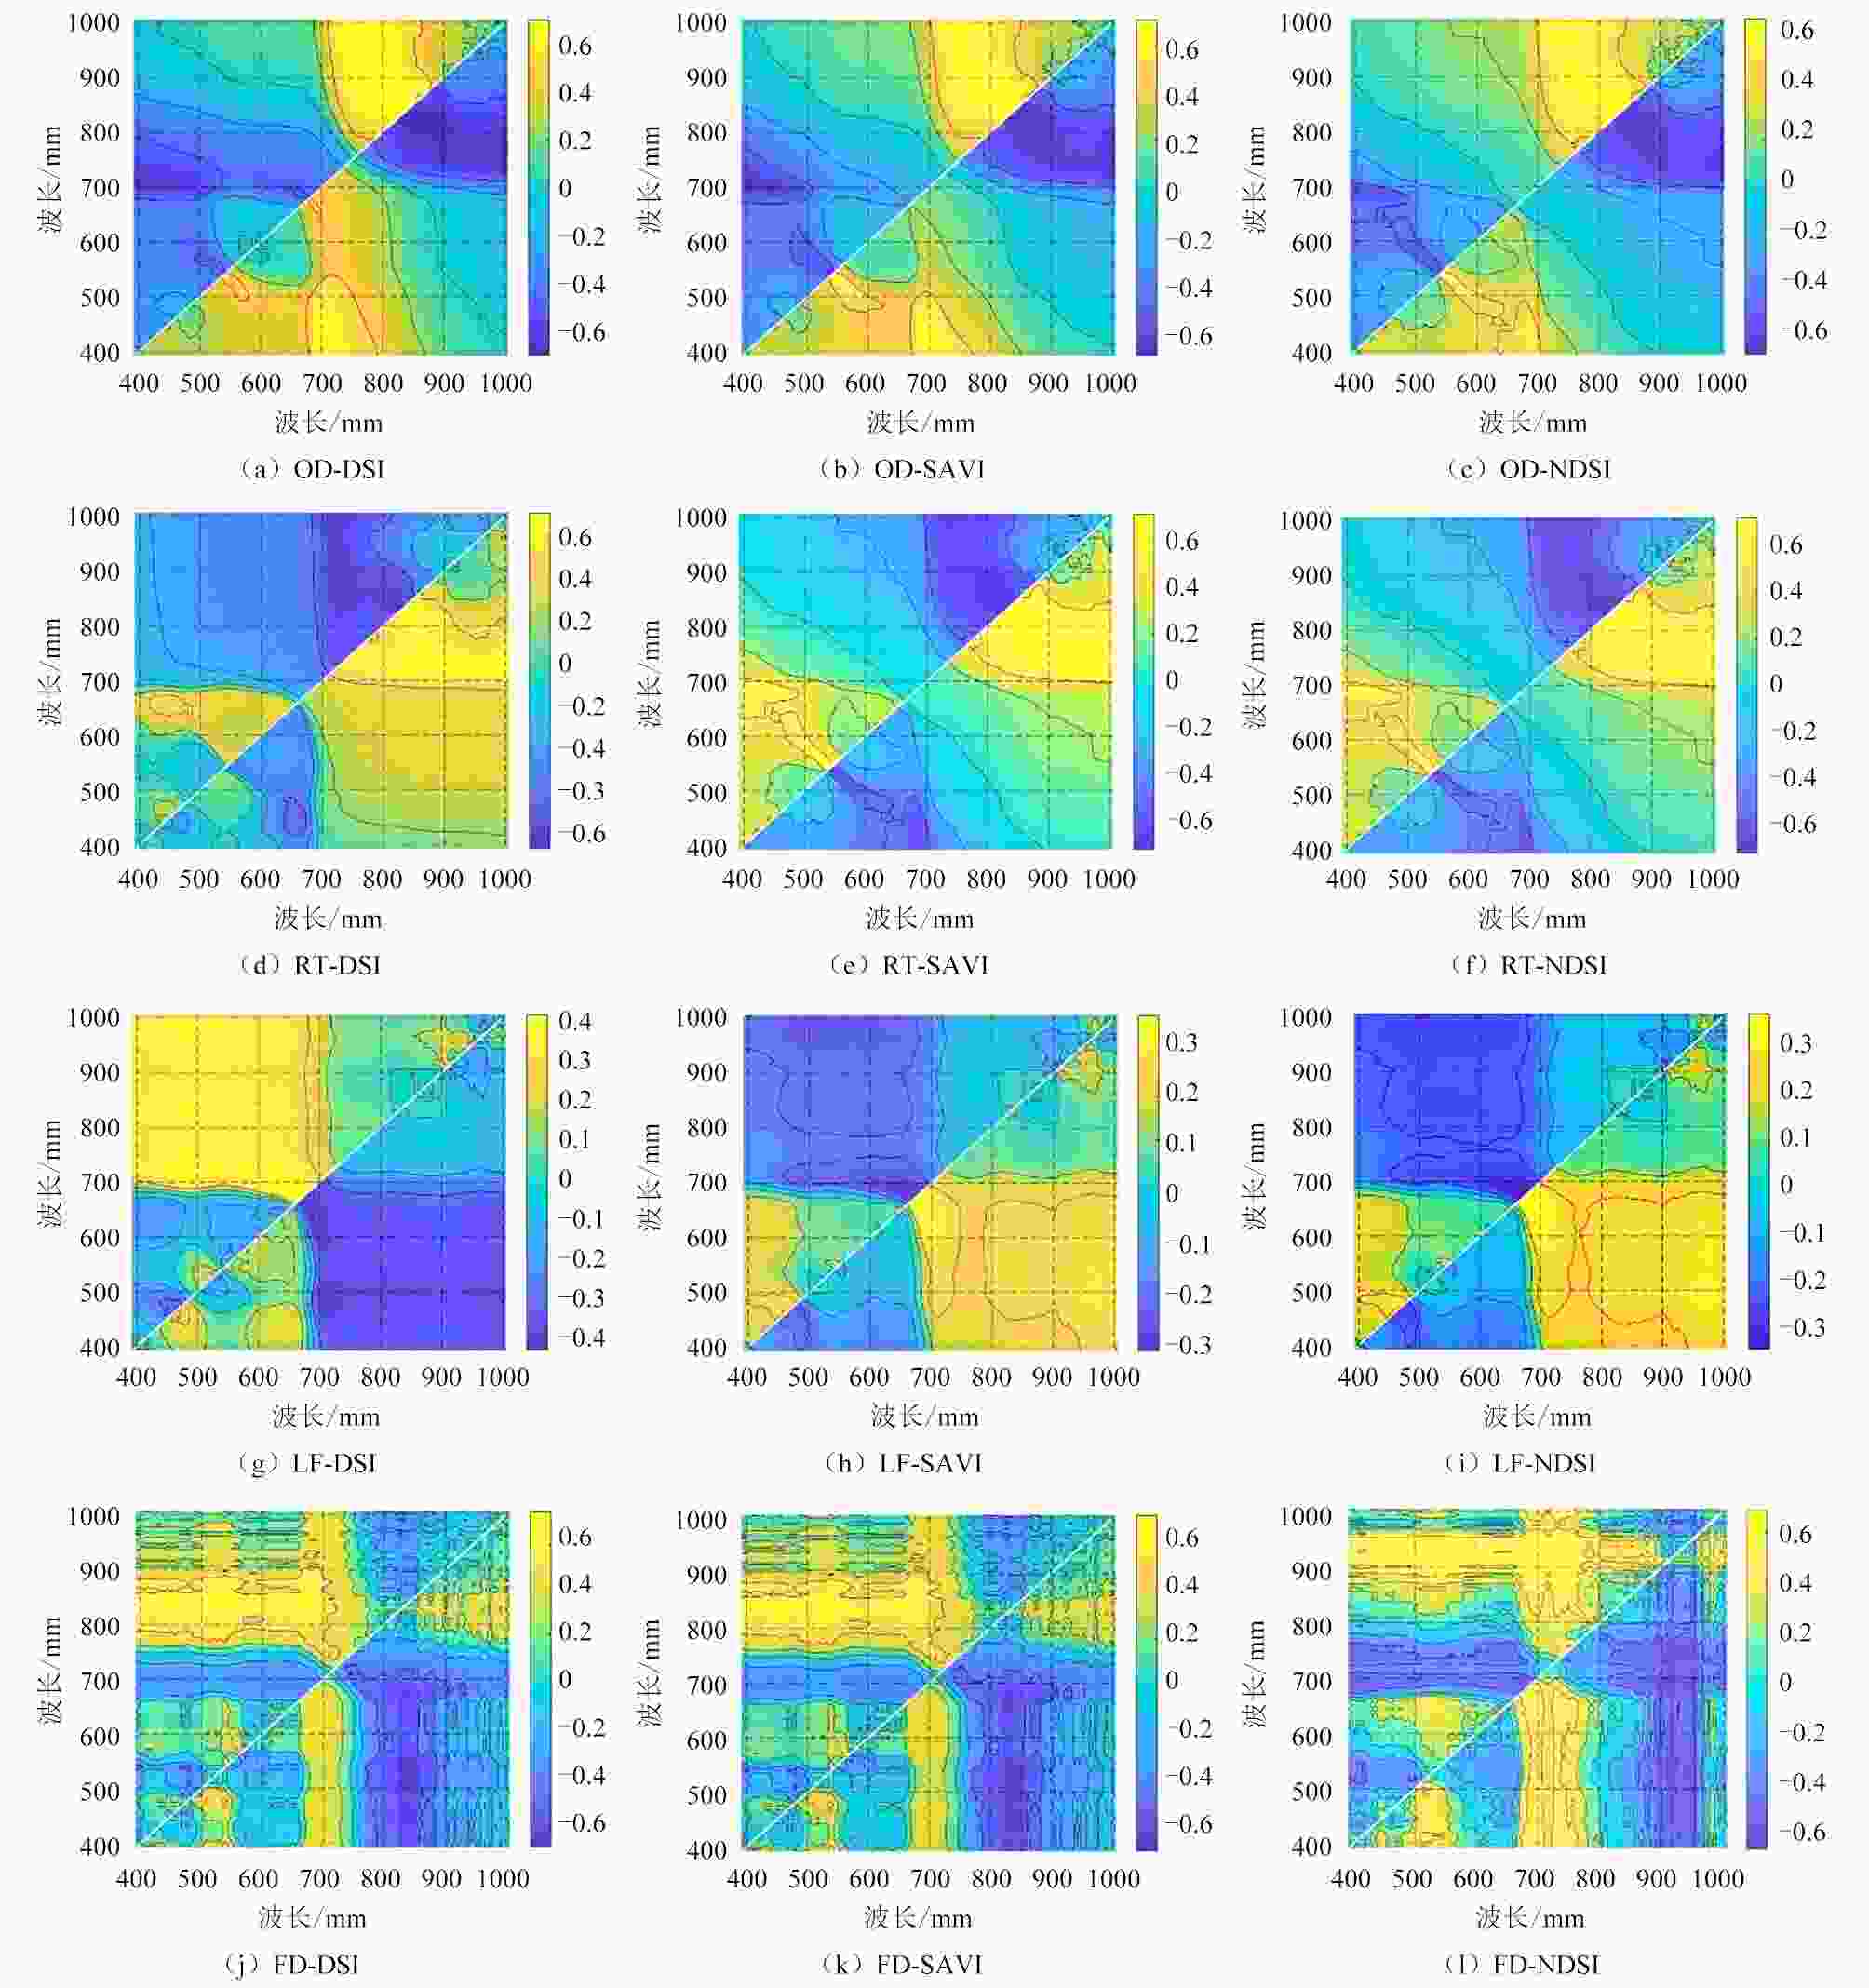
图 3 人工灌溉区任意两波段组合与LNC相关关系
Figure 3. Correlation between any two bands combination and LNC in artificial irrigation area
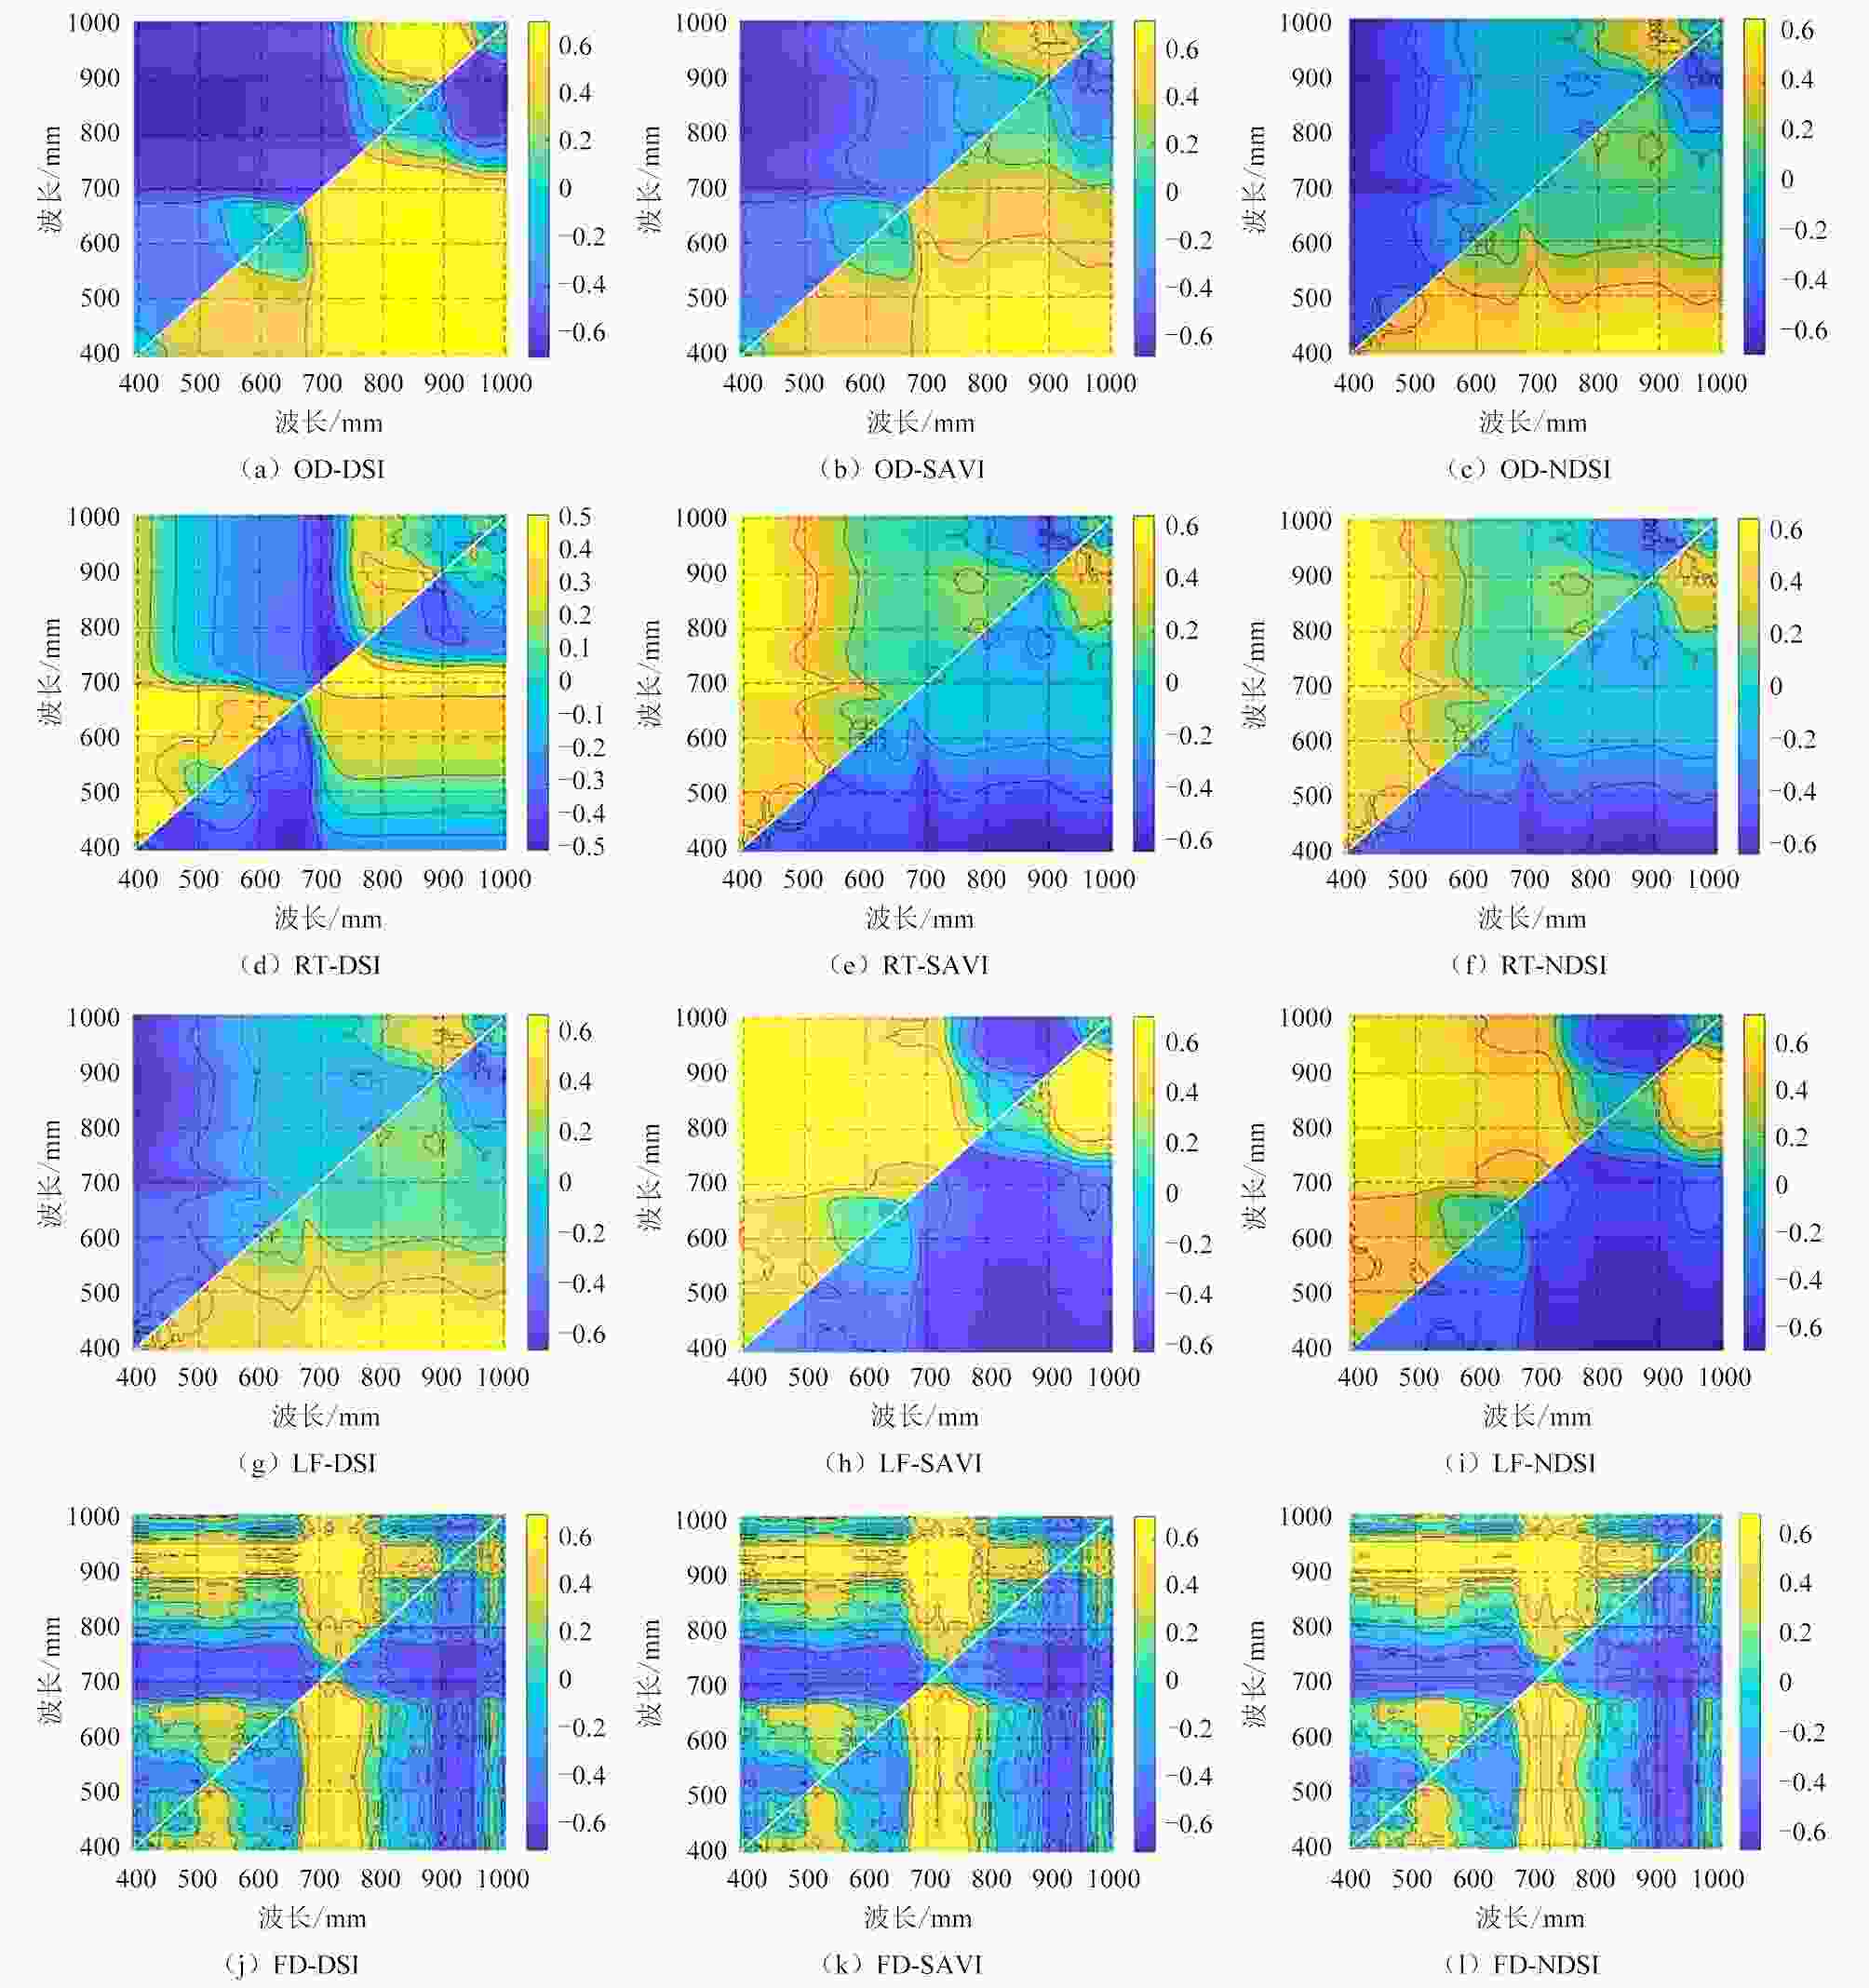
图 4 自然降雨区任意两波段组合与LNC相关关系
Figure 4. Correlation between any two bands combination and LNC in natural rainfall area
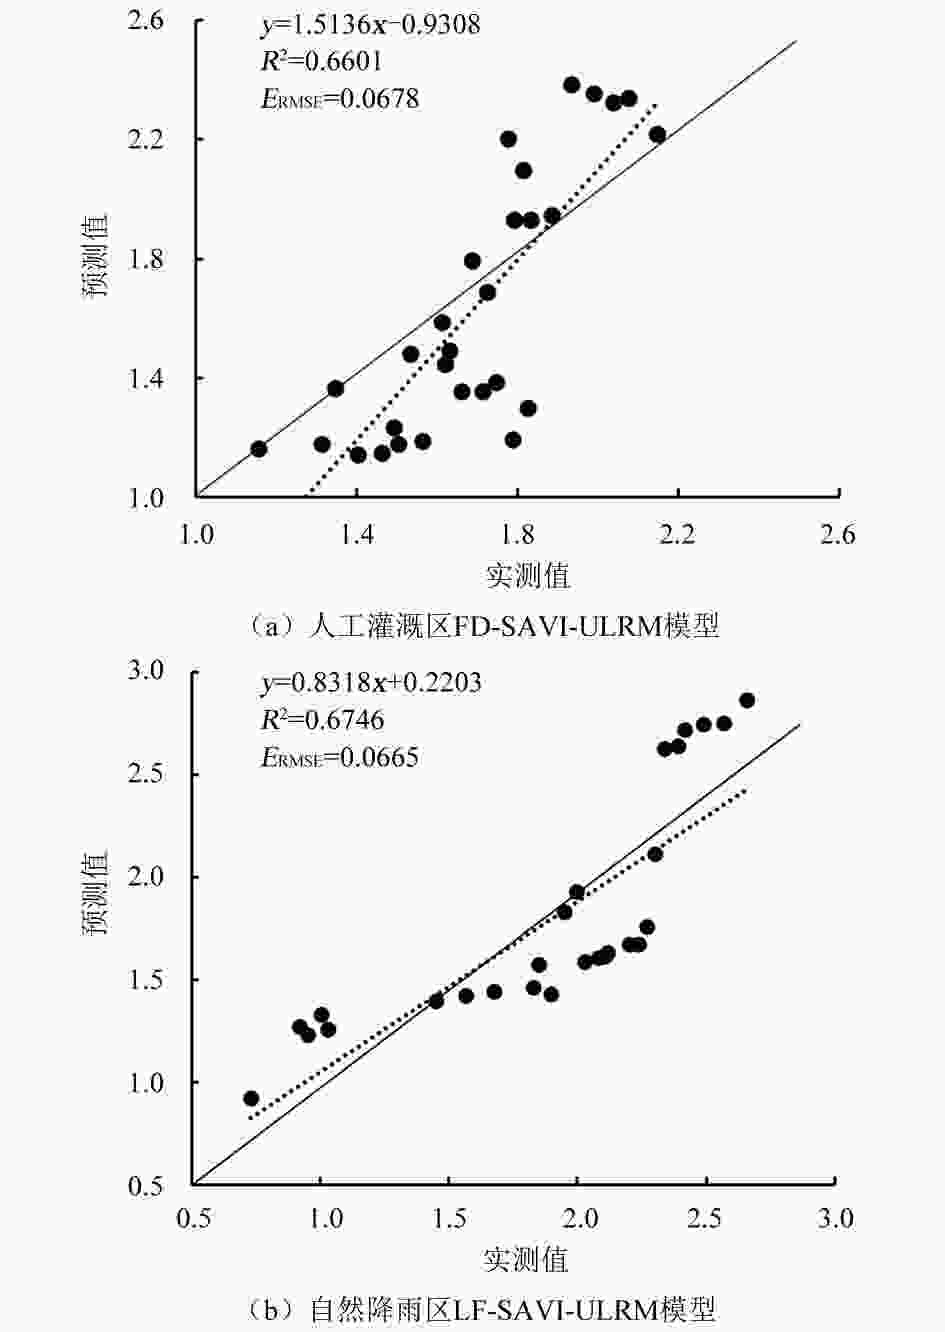
图 5 人工灌溉区与自然降雨区LNC预测值与实测值相关性
Figure 5. Correlation between predicted and measured values of LNC in artificial irrigation area and natural rainfall area

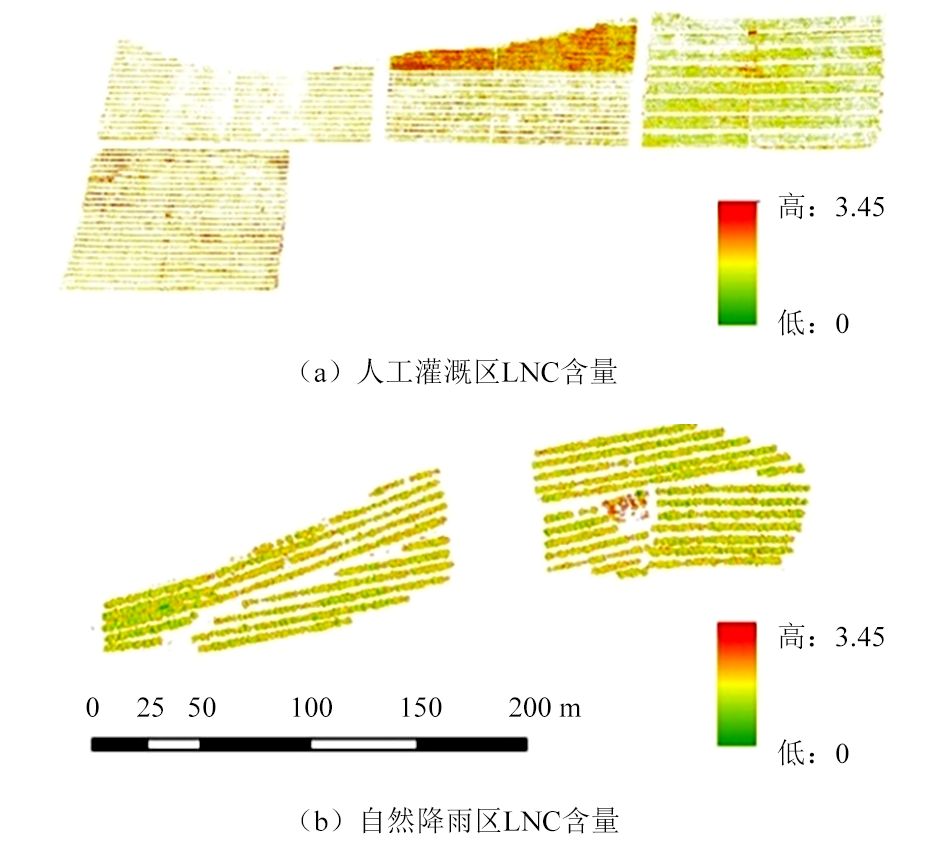
图 6 人工灌溉区与自然降雨区叶片LNC反演估测
Figure 6. Inversion and estimation of leaf LNC in artificial irrigation area and natural rainfall area
表 1 人工灌溉区叶片氮含量统计特征
Table 1. Statistical characteristics of leaf nitrogen content in artificial irrigation area
数据集 样本集数 最小值/% 最大值/% 平均值/% 标准差/% 变异系数/ % 建模集 54 1.41 2.56 2.00 0.29 14.5 预测集 26 1.46 2.64 2.00 0.28 14.0 总值 80 1.41 2.56 2.00 0.29 14.5  下载: 导出CSV
表 2 自然降雨区叶片氮含量统计特征
Table 2. Statistical characteristics of leaf nitrogen content in natural rainfall areas
数据集 样本集数 最小值/% 最大值/% 平均值/% 标准差/% 变异系数/ % 建模集 54 1.67 3.16 2.17 0.28 12.9 预测集 26 1.67 2.61 2.11 0.21 9.9 总值 80 1.67 3.16 2.15 0.27 12.6
下载: 导出CSV
表 3 人工灌溉区与不同变换下光谱指数的相关系数
Table 3. Correlation coefficient of spectral index between artificial irrigation area and different transform
变换光谱 光谱指数 光谱波段/nm 相关系数R2 变换光谱 光谱指数 光谱波段/nm 相关系数R2 波长1 波长2 波长1 波长2 OD DSI 832 821 0.707 LF DSI 672 654 0.616 SAVI 832 821 0.708 SAVI 651 682 0.587 NDSI 832 821 0.707 NDSI 651 682 0.590 RT DSI 821 828 0.696 FD DSI 825 538 0.748 SAVI 821 832 0.707 SAVI 825 538 0.749 NDSI 821 832 0.707 NDSI 825 742 0.724
下载: 导出CSV
表 4 自然降雨区与不同变换下光谱指数的相关系数
Table 4. Correlation coefficient of spectral index between natural rainfall area and different transform
变换光谱 光谱指数 光谱波段/nm 相关系数R2 变换光谱 光谱指数 光谱波段/nm 相关系数R2 波长1 波长1 波长1 波长1 OD DSI 438 854 0.693 LF DSI 392 887 0.667 SAVI 395 858 0.708 SAVI 854 392 0.712 NDSI 392 887 0.645 NDSI 854 392 0.704 RT DSI 434 428 0.500 FD DSI 950 760 0.697 SAVI 887 392 0.641 SAVI 950 760 0.697 NDSI 887 392 0.640 NDSI 534 616 0.536
下载: 导出CSV
表 5 人工灌溉区光谱指数LNC估算模型
Table 5. LNC estimation model of spectral index of artificial irrigation area
变换光谱 光谱指数 回归方程 建模集 验证集 R2 ERMSE R2 ERMSE OD $ {DSI}_{\left(\mathrm{832,821}\right)} $ y=0.2468x−0.0027 0.5265 0.0746 0.5650 0.0738 $ {SAVI}_{\left(\mathrm{832,821}\right)} $ y=3.0125x−0.0209 0.5550 0.0748 0.5864 0.0723 $ {NDSI}_{\left(\mathrm{832,821}\right)} $ y=−8.1631x+0.2222 0.5427 0.0750 0.5321 0.0741 RT $ {DSI}_{\left(\mathrm{821,828}\right)} $ y=8.927x−0.0193 0.5302 0.0755 0.5270 0.0745 $ {SAVI}_{\left(\mathrm{821,832}\right)} $ y=2.3206x−1.0004 0.5705 0.0736 0.6004 0.0721 $ {NDSI}_{\left(\mathrm{821,832}\right)} $ y=2.081x−0.0019 0.5219 0.0744 0.5144 0.0768 LF $ {DSI}_{\left(\mathrm{672,654}\right)} $ y=2.5045x−0.0273 0.5265 0.0746 0.5301 0.0755 $ {SAVI}_{\left(\mathrm{651,682}\right)} $ y=1.0006x+0.0293 0.5972 0.0714 0.6107 0.0711 $ {NDSI}_{\left(\mathrm{651,682}\right)} $ y=2.44x−0.0134 0.5817 0.0729 0.6074 0.0704 FD $ {DSI}_{\left(\mathrm{824,538}\right)} $ y=0.2169x−0.0013 0.6013 0.0709 0.6128 0.0695 $ {SAVI}_{\left(\mathrm{824,538}\right)} $ y=1.1355x−0.0121 0.6116 0.0699 0.6601 0.0678 $ {NDSI}_{\left(\mathrm{825,742}\right)} $ y=1.1546x+1.0213 0.5957 0.0715 0.6148 0.0694
下载: 导出CSV
表 6 自然降雨区光谱指数LNC估算模型
Table 6. LNC estimation model of spectral index in natural rainfall area
变换光谱 光谱指数 回归方程 建模集 验证集 R2 ERMSE R2 ERMSE OD $ {DSI}_{\left(\mathrm{438,854}\right)} $ y=8.1265x−0.4329 0.5525 0.0727 0.6112 0.0697 $ {SAVI}_{\left(\mathrm{395,858}\right)} $ y=7.8167x−0.8079 0.6629 0.0676 0.6432 0.0683 $ {NDSI}_{\left(\mathrm{392,887}\right)} $ y=4.3781x−0.9200 0.5533 0.0726 0.5343 0.0717 RT $ {DSI}_{\left(\mathrm{434,428}\right)} $ y=47.927x−2.0837 0.5272 0.0735 0.5071 0.0742 $ {SAVI}_{\left(\mathrm{887,392}\right)} $ y=5.4514x−1.0698 0.6173 0.0696 0.5291 0.0732 $ {NDSI}_{\left(\mathrm{887,392}\right)} $ y=4.6859x−0.9252 0.6186 0.0694 0.5288 0.0733 LF $ {DSI}_{\left(\mathrm{392,887}\right)} $ y=13.662x−1.3223 0.5265 0.0736 0.5854 0.0701 $ {SAVI}_{\left(\mathrm{854,392}\right)} $ y=10.838x−0.8564 0.6161 0.0694 0.6746 0.0665 $ {NDSI}_{\left(\mathrm{854,392}\right)} $ y=8.3808x−0.6766 0.6016 0.0709 0.6636 0.0674 FD $ {DSI}_{\left(\mathrm{950,760}\right)} $ y=0.2349x−0.0109 0.5071 0.0742 0.5270 0.0731 $ {SAVI}_{\left(\mathrm{950,760}\right)} $ y=1.6481x−0.0768 0.5154 0.0739 0.5311 0.0728 $ {NDSI}_{\left(\mathrm{534,616}\right)} $ y=75.989x+1.0201 0.4994 0.0758 0.5039 0.0753
下载: 导出CSV
-
[1] 王世明.合理施氮量有效提升荒漠区葡萄果实品质[J].中国果业信息,2019,36(10): 53 . [2] PENUELAS J,FILELLA I,LLORET P,et al.Reflectance assessment of mite effects on apple trees[J].International Journal of Remote Sensing,1995,16(14): 2727 - 2733 . doi: 10.1080/01431169508954588 [3] 方孝荣,高俊峰,谢传奇,等.农作物冠层光谱信息检测技术及方法综述[J].光谱学与光谱分析,2015,35(7): 1949 - 1955 . doi: 10.3964/j.issn.1000-0593(2015)07-1949-07FANG Xiaorong,GAO Junfeng,XIE Chuanqi,et al.Review of crop canopy spectral information detection technology and methods[J].Spectroscopy and Spectral Analysis,2015,35(7): 1949 - 1955 . doi: 10.3964/j.issn.1000-0593(2015)07-1949-07 [4] BEDIDI A,CERVELLE B,MADEIRA J,et al.Moisture effects on visible spectral characteristics of lateritic soils[J].Soil Science,1992,153(2): 129 - 141 . doi: 10.1097/00010694-199202000-00007 [5] STENBERG B,ROSSEL R A V,MOUAZEN A M,et al.Visible and near infrared spectroscopy in soil science[J].Advances in Agronomy,2010,107: 163 - 215 . [6] 李艳大,曹中盛,孙滨峰,等.江西双季稻氮素监测诊断模型的建立与应用[J].应用生态学报,2020,31(2): 433 - 440 .LI Yanda,CAO Zhongsheng,SUN Binfeng,et al.Model construction and application for nitrogen nutrition monitoring and diagnosis in double-cropping rice of Jiangxi Province,China[J].Chinese Journal of Applied Ecology,2020,31(2): 433 - 440 . [7] 李丙智,李敏夏,周璇,等.苹果树叶片全氮含量高光谱估算模型研究[J].遥感学报,2010,14(4):761-773.LI Bingzhi,LI Minxia,ZHOU Xuan,et al.Hyperspectral estimation models for nitrogen contents of apple leaves[J] National Remote Sensing Bulletin,2010,14(4):761-773. [8] 宋红燕,胡克林,彭希.基于高光谱技术的覆膜旱作水稻植株氮含量及籽粒产量估算[J].中国农业大学学报,2016,21(8): 27 - 34 .SONG Hongyan,HU Kelin,PENG Xi.Crop nitrogen content diagnosis and yield estimation in ground cover rice production system based on hyperspectral data[J].Journal of China Agricultural University,2016,21(8): 27 - 34 . [9] 张瑶,郑立华,李民赞,等.基于光谱特征分析的苹果树叶片营养素预测模型构建[J].农业工程学报,2013,29(8): 171 - 178 .ZHANG Yao,ZHENG Lihua,LI Minzan,et al.Construction of apple tree leaves nutrients prediction model based on spectral analysis[J].Transactions of the Chinese Society of Agricultural Engineering,2013,29(8): 171 - 178 . [10] NARMILAN A,GONZALEZ F,SALGADOE A S A,et al.Predicting canopy chlorophyll content in sugarcane crops using machine learning algorithms and spectral vegetation indices derived from UAV multispectral imagery[J].Remote Sensing,2022,14(5): 1140 . doi: 10.3390/rs14051140 [11] 谭昌伟,周清波,齐腊,等.水稻氮素营养高光谱遥感诊断模型[J].应用生态学报,2008(6): 1261 - 1268 .TAN Changwei,ZHOU Qingbo,QI La,et al.Hyperspectral remote sensing diagnosis models of rice plant nitrogen nutritional status[J].Chinese Journal of Applied Ecology,2008(6): 1261 - 1268 . [12] 朱西存,赵庚星,王凌,等.基于高光谱的苹果花氮素含量预测模型研究[J].光谱学与光谱分析,2010,30(2): 416 - 420 . doi: 10.3964/j.issn.1000-0593(2010)02-0416-05ZHU Xicun,ZHAO Gengxing,WANG Ling,et al.Hyperspectrum based prediction model for nitrogen content of apple flowers[J].Spectroscopy and Spectral Analysis,2010,30(2): 416 - 420 . doi: 10.3964/j.issn.1000-0593(2010)02-0416-05 [13] 李金梦,叶旭君,王巧男,等.高光谱成像技术的柑橘植株叶片含氮量预测模型[J].光谱学与光谱分析,2014,34(1): 212 - 216 . doi: 10.3964/j.issn.1000-0593(2014)01-0212-05LI Jinmeng,YE Xujun,WANG Qiaonan,et al.Development of prediction models for determining N content in citrus leaves based on hyperspectral imaging technology[J].Spectroscopy and Spectral Analysis,2014,34(1): 212 - 216 . doi: 10.3964/j.issn.1000-0593(2014)01-0212-05 [14] 王雪.杜马斯燃烧法和凯式定氮法在小麦氮含量测定中的应用研究[J].农业技术与装备,2020(11): 7 - 8 . doi: 10.3969/j.issn.1673-887X.2020.11.002WANG Xue.Application of Dumas combustion and Kjeldahl methods in the determination of nitrogen concentration in wheat[J].Agricultural Technology and Equipment,2020(11): 7 - 8 . doi: 10.3969/j.issn.1673-887X.2020.11.002 [15] 黄宇,陈兴海,刘业林,等.无人机高光谱内置推扫影像快速拼接方法[J].测绘地理信息,2019,44(5):24-28.HUANG Yu,CHEN Xinghai,LIU Yelin,et al.UAV hyperspectral built-in push-scan image fast splicing method[J] Journal of Geomatics,2019,44(5):24-28. [16] 于雷,洪永胜,耿雷,等.基于偏最小二乘回归的土壤有机质含量高光谱估算[J].农业工程学报,2015,31(14): 103 - 109 . doi: 10.11975/j.issn.1002-6819.2015.14.015YU Lei,HONG Yongsheng,GENG Lei,et al.Hyperspectral estimation of soil organic matter content based on partial least squares regression[J].Transactions of the Chinese Society of Agricultural Engineering,2015,31(14): 103 - 109 . doi: 10.11975/j.issn.1002-6819.2015.14.015 [17] SHI T,CHEN Y,LIU Y,et al.Visible and near-infrared reflectance spectroscopy:an alternative for monitoring soil contamination by heavy metals[J].Journal of Hazardous Materials,2014,265: 166 - 176 . doi: 10.1016/j.jhazmat.2013.11.059 [18] DAUGHTRY C S T,WALTHALL C L,KIM M S,et al.Estimating corn foliar chlorophyll content from leaf and canopy reflectance[J].Remote Sensing of Environment,2000,74(2): 229 - 239 . doi: 10.1016/S0034-4257(00)00113-9 [19] ZHEN Z,CHEN S,YIN T,et al.Using the negative soil adjustment factor of soil adjusted vegetation index (SAVI) to resist saturation effects and estimate leaf area index (LAI) in dense vegetation areas[J].Sensors,2021,21(6): 2115 . doi: 10.3390/s21062115 [20] NAVARRO G,CABALLERO I,SILVA G,et al.Evaluation of forest fire on Madeira Island using Sentinel-2A MSI imagery[J].International Journal of Applied Earth Observation and Geoinformation,2017,58: 97 - 106 . doi: 10.1016/j.jag.2017.02.003 [21] 秦根泉,田慧,苏晓林.土坝渗压分析一元线性回归模型构建与应用[J].水利建设与管理,2022,42(3): 73 - 80 .QIN Genquan,TIAN Hui,SU Xiaolin.Construction and application of unitary linear regression model for earth dam seepage pressure analysis[J].Water Conservancy Construction and Management,2022,42(3): 73 - 80 . [22] ROSSEL R A V,MCGLYNN R N,MCBRATNEY A B.Determining the composition of mineral-organic mixes using UV-VIS-NIR diffuse reflectance spectroscopy[J].Geoderma,2006,137(1/2): 70 - 82 . -

 下载:
下载:


 点击查看大图
计量
- 文章访问数: 23
- HTML全文浏览量: 6
- PDF下载量: 8
- 被引次数: 0
 京公网安备 11010502037498号
